By Bev Clark, for the Lake of the Woods Water Sustainability Foundation
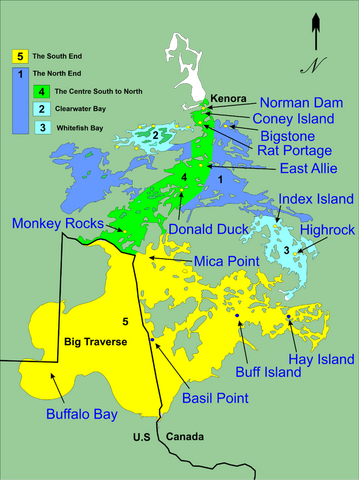 Figure 1: Five different areas of Lake of the Woods that have different water quality.Lake of the Woods (LoW) has a great deal of variation in water quality from place to place. Here we are going to look at differences in total phosphorus (TP) concentrations among five distinctly different areas of the lake. We are using TP because it is the nutrient that dictates how productive the water is and hence how much algae the water can support.
The lake can be generally divided into two main basins – one is fairly homogeneous (south), the other is fairly complicated (north). The south basin, shown as the yellow area (5) in Figure 1, receives water from the Rainy River. This water is nutrient-rich, and the south end of the lake reflects this high concentration of TP with its high productivity and tendency to support algal blooms. From here, the nutrient-rich water in the lake flows like a river from the Rainy River in the south to the outflow at the Norman Dam in Kenora – this is shown as the green area (4). This area through the central portion of the lake has a range in TP concentrations from higher in the south to lower at the north. The rest of the north basin of the lake (the blue area 1 on Figure 1) has much lower TP concentrations due to contributions from dilute watershed sources and due to nutrients settling out as they arrive from the south end of the lake.
Within the north basin, there are two other areas that have different water quality attributes. These are the two isolated bays, the Ptarmigan-Clearwater Bay area (2) and Whitefish Bay (3), and both have very low TP concentrations because they are not influenced by the flow from the Rainy River. Bear in mind that these are all generalizations and there are many exceptions to this high-level look at water quality.
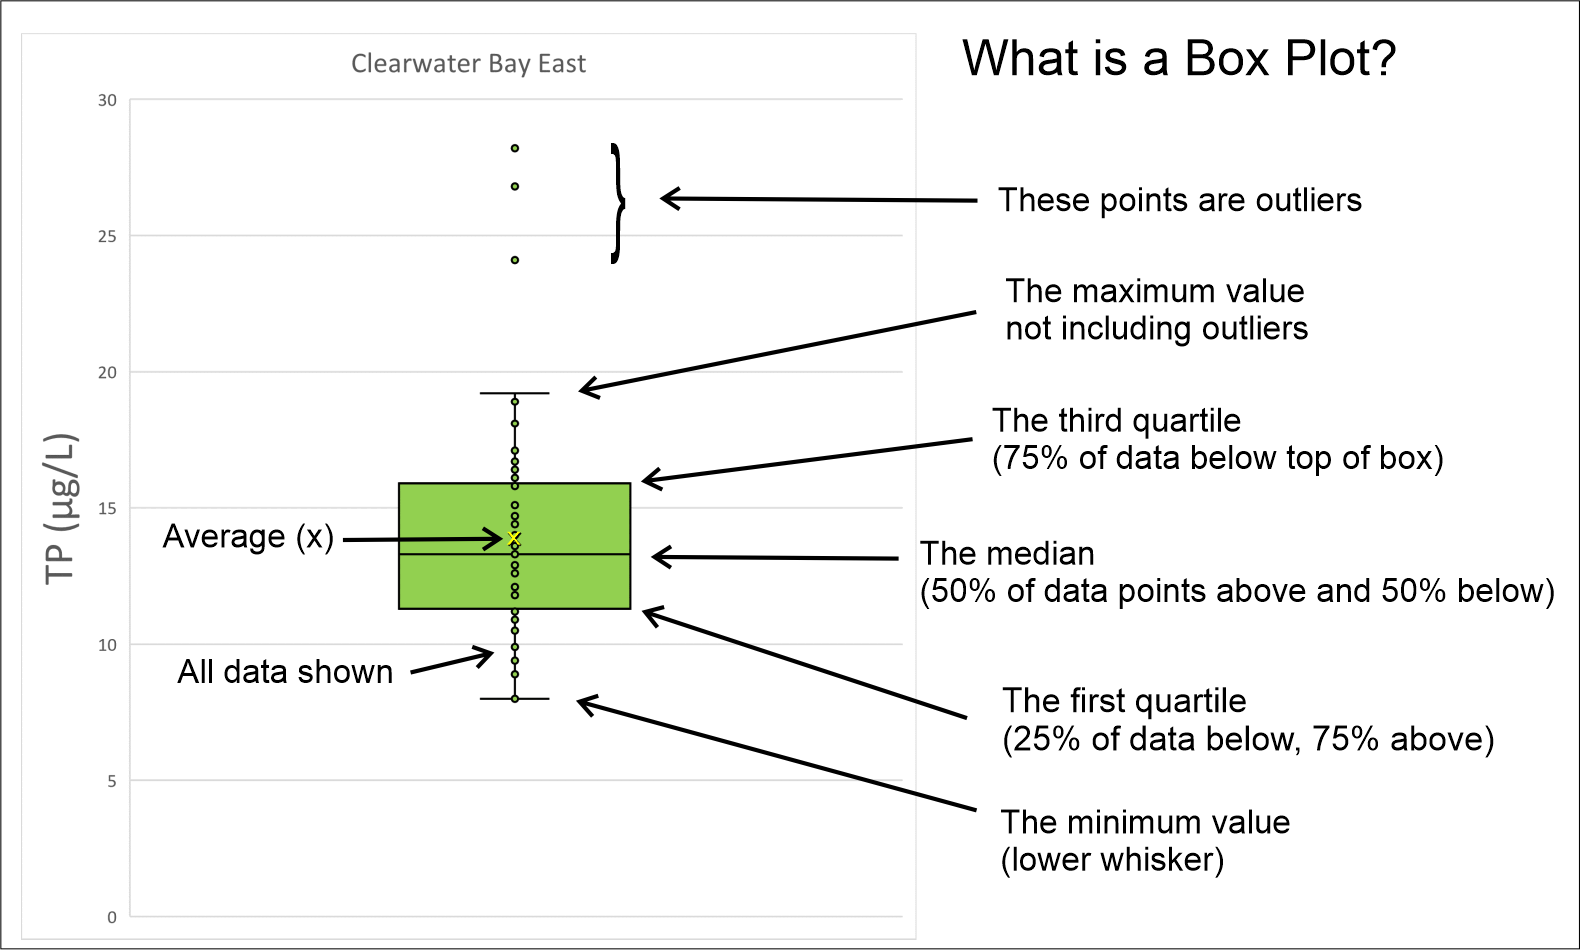 Figure 2: How to read a Box and Whiskers Plot (click to enlarge)Let’s have a look at the TP concentrations in each of the five areas of the lake. For this we can use "box and whisker" plots which are a useful way to visualize ranges and averages in large data sets. For an explanation of how to read these box plots, see Figure 2: "What is a box plot" -- click image to enlarge).
First let’s look at the areas that are easier to describe. These are the northwest around Clearwater Bay (Area 2), Whitefish Bay (Area 3), the north end of the lake (Area 1) and the south end of the lake (Area 5). The boxplots for the four different areas are shown in Figure 2. These box blots combine the data from multiple sample locations shown on the map and water quality for the north basin is represented by Bigstone Bay.
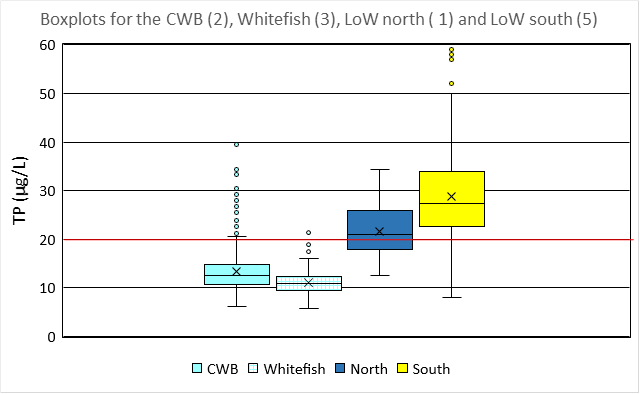 Figure 3 - Total phosphorus boxplots for four different areas of Lake of the Woods (2, 3, 1, and 5, shown in Figure 1).You can see that the TP concentrations for the Ptarmigan-Clearwater Bay area (NW) and for Whitefish Bay are quite low, around 10-15 µg/L. This is oligotrophic water indicating very little chance of supporting algal blooms. The north basin of the lake (1) is generally around 20 µg/L or slightly higher and this is mesotrophic water which may or may not support algal blooms. If you want to see more detailed TP data for the north end of the lake, please consult the Lake Partner Program interactive map.
The water in the south (5) is around 30 µg/L TP with the top of the whisker at 50 µg/L. This is just asking for severe algal blooms. Concentrations are shown relative to 20 µg/L (the red line) which is considered acceptable water quality by the Ontario Provincial Water Quality Objectives. Water below 20 μg/L has a reduced risk of nuisance algal blooms.
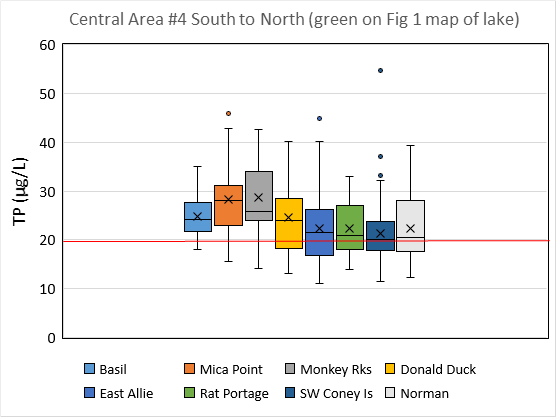 Figure 4: Boxplots for total phosphorus for sample locations throughout the central portion of Lake of the Woods. Stations are shown from the south (left) to the north (right). The red line shows 20 ug/L which is acceptable water quality.Now for the more interesting piece. Area 4 on Figure 1 shows the water in the central portion of the lake between the point where it leaves the Big Traverse in the south and where it exits the lake near Kenora. The box plots for eight sample locations are shown in Figure 3 with the southmost station at the left of the graph and the outflow at the right. Most of the concentrations are above 20 µg/L but they are generally closer to 30 µg/L in the south and closer to 20 µg/L in the north. The water is diluted as it moves north due to settling of nutrients and due to inputs of less productive water from the Canadian Shield areas of the watershed.
The science behind the lakewide variation in water quality is discussed in detail in the 3rd Edition of the Rainy-Lake of the Woods State of the Basin Report. Nutrient sources including internal loads from lake sediments, erosion, Rainy River inputs and septic systems are discussed together with different projects that recommend nutrient reductions. We encourage you to get a copy and read on in more detail! The report is available in two versions: a 148 page full technical report and a 32 page summary Overview version written for a more public audience, on the LOWWSF website, lowwsf.com/sobr.